Variation in radiation counts
What to make of the variation in radiation counts?
Statistics:
- Min 5 at 363; Max 33 at 1447
- Mean 16.28; Median 16
- Std. dev. 4.095 $\approx$ 4.1
Standard deviation
Here are the first 20 1-minute counts for the "all day" GC counting:
- "Mean" = average
- "Median": Half the measurements are above this value, half are below.
- The "deviation" for one particular measurement is
- dev= Counts - average(Counts).
- Why is the average of the deviations not useful for talking about how much variation there is in the data?
- The "Standard deviation", $\sigma$, for our purposes is: $$\sigma = \sqrt{\text{Average(}\text{dev}^2\text{)}}.$$
In a course on probability and statistics, you would find that for many kinds of random processes:
- 68% of measurements are between $\text{ave}-\sigma$ and $\text{ave}+\sigma$.
- 95% of measurements are between $\text{ave}-2\sigma$ and $\text{ave}+2\sigma$.
- 99.7% of measurements are between $\text{ave}-3\sigma$ and $\text{ave}+3\sigma$.
- ...
GC data
Here are the histograms from the 1 minute counts and the 10-minute averages for the GC data:
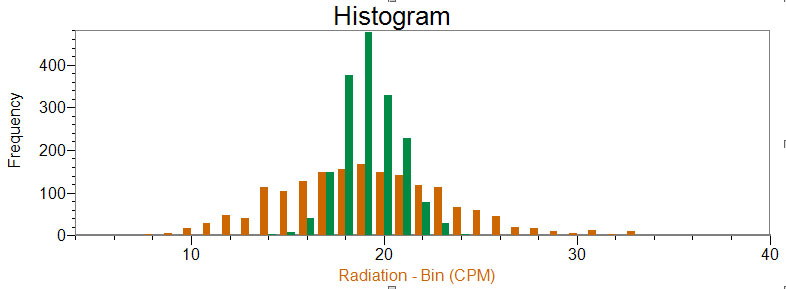
There is a trick we can use to connect the standard deviation of the 1-minute counts with the width of the 10-min average histogram....