9.6 - Projections of a curve
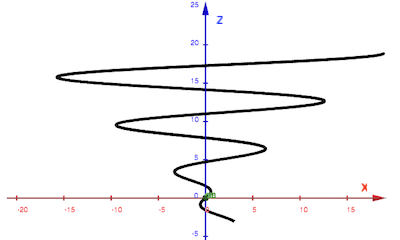
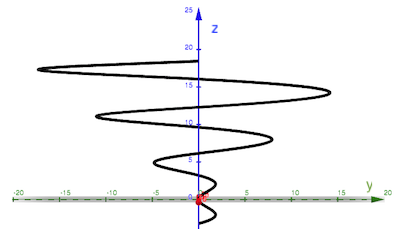
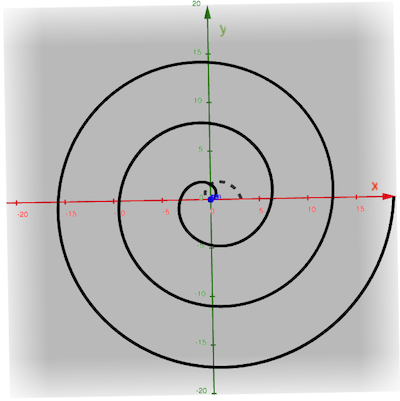
- Consider the curve described by $\myv r(t) = \myc{t \cos t , t \sin t ,t}$
Sketch three planar projections: $x(z)$ (ignoring $y$), $y(z)$ (ignoring $x$), and $y(x)$ (ignoring $z$). Can you visualize the entire curve by looking at the projections?
Can you visualize the entire curve by looking at the projections? [Check yourself by using GeoGebra's Curve function where enter a parametric equation for each coordinate. In this case:
Curve(t*cos(t), t*sin(t), t, t, t_min, t_max).
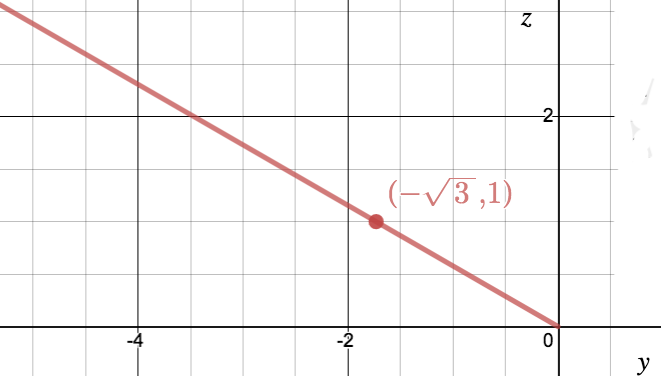
- Consider the curve given by $\myv r(t) = t \uv i − \frac{\sqrt{3}}{2} t^2 \uv j + \frac12 t^2 \uv k$.
Sketch three planar projections, $y(x)$, $z(y)$.Hint: When you're sketching $z(x)$ vs $y(x)$, and $z(y)$. It may be useful to think of $t^2$ as the parameter. Call it $t^2=s$ and sketch $z(s)$ vs $y(s)$. But because $t^2$ can never be negative, $s$ can only take on positive values.
- Projection in the $xy$ plane: ignoring $z$, we have $\myv r(t)=t\uv i - \frac{\sqrt{3}}{2} t^2\uv j$. Since $x=t$, we can graph $y(x)=-\frac{\sqrt 3}{2}x^2$. So, $y(x)$ is parabola, opening downwards, with its vertex at the origin.
- In the $xz$ plane: $z(x)=\frac 12 x^2$. So, $z(x)$ is a parabola, open upwards, with its vertex at the origin.
- In the $yx$ plane: $\myv r(t)=-\frac{\sqrt{3}}{2} t^2\uv i+\frac{1}{2}t^2\uv j$. We could parameterize this using $s=t^2$, as $$\myv r(s)=-\frac{\sqrt{3}}{2}s\,\uv j+\frac{1}{2}s\,\uv k\ \ \ \ \text{for }0 \leq s.$$ Though $t$ is allowed to be any real number, $t^2=s$ is only ever 0 or positive. This looks like a line that stops at the origin. When $s=2$, $\myv r(2)=(-\sqrt 3, 1)$:
- In the $yx$ plane: $\myv r(t)=-\frac{\sqrt{3}}{2} t^2\uv i+\frac{1}{2}t^2\uv j$. We could parameterize this using $s=t^2$, as $$\myv r(s)=-\frac{\sqrt{3}}{2}s\,\uv j+\frac{1}{2}s\,\uv k\ \ \ \ \text{for }0 \leq s.$$ Though $t$ is allowed to be any real number, $t^2=s$ is only ever 0 or positive. This looks like a line that stops at the origin. When $s=2$, $\myv r(2)=(-\sqrt 3, 1)$: