[6.1-5] Function Transformations
scale.nb
Print out the first couple of pages
Heating schedule for a building
To save money, an office building is kept warmest during business hours. During the night, the building's temperature is cool, 50 F. From 6 am to 8 am the building is warmed linearly up to 70 F, and from 4 pm to 8 pm the building is allowed to cool linearly back down to 50 F. Let $f(t)$ be the temperature $t$ hours after midnight.
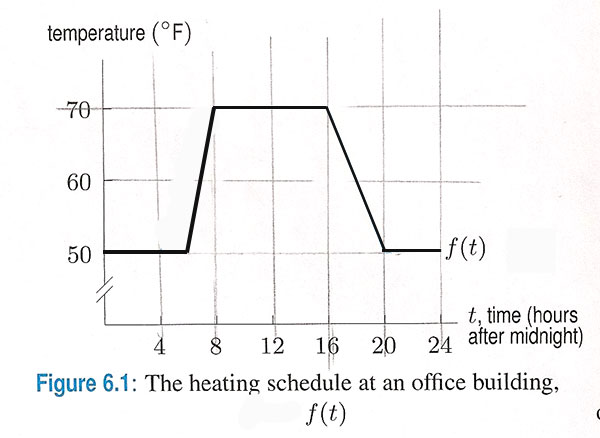
| $t$ | 0 | 2 | 4 | 6 | 8 | 10 | 12 | 14 | 16 | 18 | 20 | 22 | 24 |
| $f(t)$ | 50 | 50 | 50 | 50 | 70 | 70 | 70 | 70 | 70 | 60 | 50 | 50 | 50 |
| $g(t)$ | |||||||||||||
| $h(t)$ |
Let $g(t)=f(t)+5$. Fill in as much of the table as you need to, graph $g(t)$ and interpret $g$. Describe *visually* what you would do to the graph of $f(t)$ to get the graph of $g(t)$.
Let $h(t)=f(t+4)$. Fill in as much of the table as you need to, graph $h(t)$, and describe *visually* what you would do to the graph of $f(t)$ to get the
graph of $g(t)$.
First summary
Where $k$ is some positive constant.
| Function definition |
How does the graph compare to the graph of $f(x)$? |
| $f(x)+k$ $f(x)-k$ $f(x+k)$ $f(x-k)$ |
shifted up by $k$ units shifted down by $k$ units shifted left by $k$ units shifted right by $k$ units |
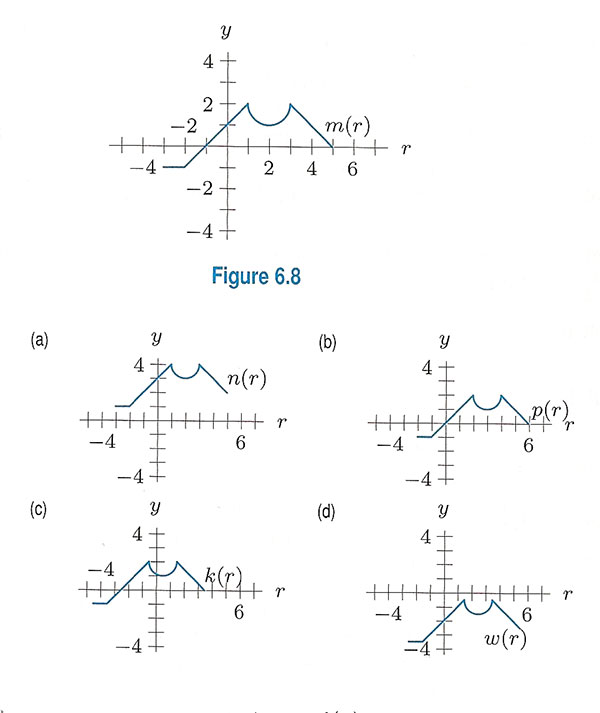
Shifts problem
Express each of the four functions shown below in terms of $m(r)$.
What about lines?
What is the slope of $f(x)=x$? $f(x)+3$? $f(x-2)$?
"Reflections"
 Let $f(0)=1$, $f(1)=4$, $f(2)=3$, and let $f$ be changing linearly between each pair of successive points.
- graph $f$.
- let $g(x)=-f(x)$. Graph $g$.
- let $h(x)=f(-x)$. Graph $h$.
2nd summary
Where $k$ is a positive constant.
| Function definition | How does the graph compare to the graph of $f(x)$? |
| $-f(x)$ $f(-x)$ | Reflects (or flips) the graph over the $x$ axis Reflects the graph over the $y$ axis |
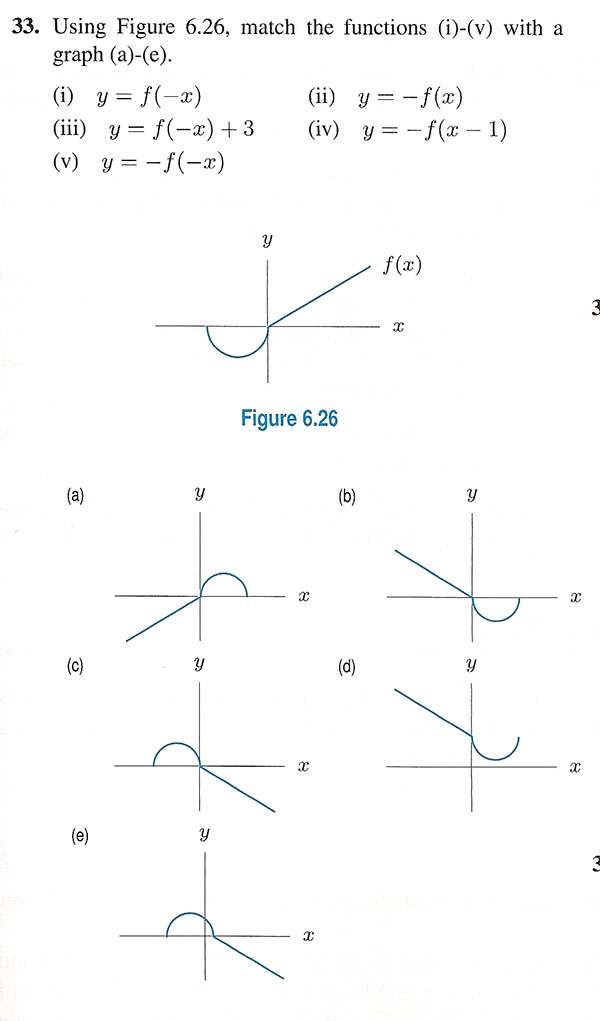
Reflections problem
Match up the functions with the graphs
Stretches / compressions
| $t$ | 0 | 2 | 4 | 6 | 8 | 10 | 12 | 14 | 16 | 18 | 20 | 22 | 24 |
| $f(t)$ | 50 | 50 | 50 | 50 | 70 | 70 | 70 | 70 | 70 | 60 | 50 | 50 | 50 |
| $a(t)$ | |||||||||||||
| $b(t)$ |
Let $a(t)=1.1f(t)$. Fill in as much of the table as you need to, graph $a(t)$ and interpret $a$.
Let $b(t)=f(2t)$. Fill in as much of the table as you need to, graph $b(t)$, and interpret $b$.
Again, Let $f(0)=1$, $f(1)=4$, $f(2)=3$, and let $f$ be changing linearly between each pair of successive points.
- graph $f$.
- let $a(x)=\frac 12f(x)$. Graph $a$.
- let $b(x)=f(\frac 12x)$. Graph $b$.
3rd summary
Where $k$ is a positive constant.
| Function definition | How does the graph compare to the graph of $f(x)$? |
|
[$k > 1$] $kf(x)$ $f(kx)$ [$0 < k < 1$] $kf(x)$ $f(kx)$ |
stretched compressed horizontally by a factor $1/k$, towards the $y$-axis Compressed vertically by a factor of $k$, towards the $x$-axis Stretched horizontally by a factor of $1/k$ away from the $y$-axis |
What about lines?
What is the slope of $f(x)=2x+1?$? of $1.7*f(x)$? of $f(2*x)$? of $f(\frac 13 x)$?
Working with functions and formulas
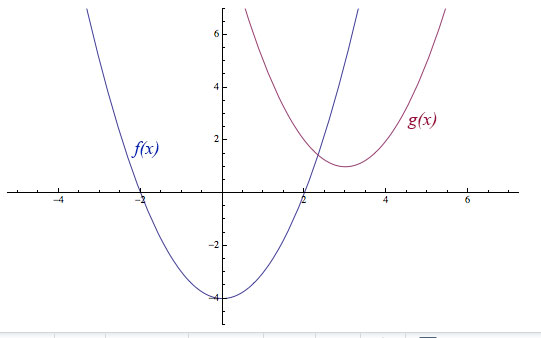
- From the graph, define $g(x)$ in terms of visual transformations that you make to $f(x)$.
- Figure out a formula for $f(x)$.
- Use your answer from 1) and your knowledge of function transformations to find a formula for $g(x)$.
- Verify by calculating a few points.
Even
If $h(x)= f(-x)$, describe what the graph of $h(x)$ looks like, in relation to the graph of $f(x)$.
An even function has the property that $f(-x)=f(x)$.
So, what must a function that is even look like on a graph?
Is either one / both /neither of these functions even?Odd
Now let $f(-1)=1$, $f(0)=1$, $f(1)=4$, $f(2)=3$,
and let $f$ be changing linearly between each pair of successive points.
- graph $f$.
- let $b(x)=-f(-x)$. Graph $b$.
Describe $b$ in terms of transformations of $f$.
A function is odd if $$-f(-x)=f(x).$$
Which of these polynomials are odd? (Try out x=1, x=2,)
- $f(x)=x$,
- $x^2$,
- $x^3$,
- $(x-3)(x)(x+3)=x^3-6x^2-9x$.
If $f(x)$ is an odd function, and its domain is [-10,10], what one point *must* the graph of $f(x)$ pass through?
Combining transformations
See this practice sheet
Exponentials
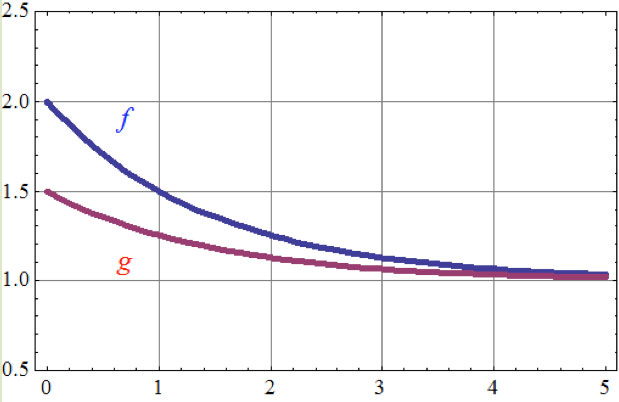
These are the graphs of $f(x)=2^{-x}+1$ and $g(x)=2^{-(x+1)}+1$. How are these graphs related?Visually, is there an alternative way that you see to think about this transformation?