Gravity and acceleration
 That acceleration assignment...
From a->b: $$v=\frac{\Delta d}{\Delta t} = \frac{0.4 \text{ cm}}{0.1 \text{ s}}=4\text{ cm/s}$$
From c->d: $$v=\frac{\Delta d}{\Delta t} = \frac{1.2 \text{ cm}}{0.1 \text{ s}}=12\text{ cm/s}$$
Acceleration From (ab)->(cd): $$a=\frac{\Delta v}{\Delta t} = \frac{12 - 4 \text{ cm/s}}{0.4 \text{ s}}=\frac{8}{0.4}\text{ cm/s/s}=20 \text{ cm/s/s}$$
Average speed for a->d:
$$v=\frac{\Delta d}{\Delta t} = \frac{4.2 \text{ cm}}{0.5 \text{ s}}=8.4\text{ cm/s}$$
Falling objects lab
For falling objects, you found this kind of data...
We wanted to look at the question Does the mass of the object change how it falls?
We looked at a tweaked version of this question: Does the mass of an object change how it accelerates? .
Acceleration = $\Delta v/\Delta t$ is the slope of the best-fit line to your $v(t)$ vs $t$ graph.
- Results from this year (.xlsx)
Statistics!!!
The average
As a class we made 14 measurements. Call $14=n$. The first measurement was $a_1$. The second $a_2$, etc. The average is sometimes written as $\bar a$, where: $$\bar a = \frac{a_1+a_2+a_3+....a_n}{n}.$$
How does the average acceleration for light objects compare with the average for heavy objects?
The standard deviation
It would be useful to have some "error bars" on our acceleration estimates. If you have many measurements, here is the most commonly used technique:
- How far is each measurement from the average?
- This is called the deviation: $\Delta a_1 = a_1-\bar a$.
- No matter how spread out the data is, there are typically just as many points above as below the average. So, the average value of the deviations will be close to zero, and is not very helpful.
- Instead, *square* each deviation and find the average of those: $$\bar{(\Delta a)^2} = \frac{(\Delta a_1)^2+(\Delta a_2)^2+...(\Delta a_n)^2}{n}$$
- Now take the square root of that average. This is called the "standard deviation" and is written with the greek letter $\sigma$ (sigma): $$\sigma=\sqrt{\bar{(\Delta a)^2}}.$$
Statisticians tell us that in general,
If you make repeated measurements of a quantity, $a$, ~70% of your measurements will be in the range: $$\bar a - \sigma \lt a \lt \bar a + \sigma$$
[See the "68-95-99.7 rule".]
Here's our acceleration data for light objects:
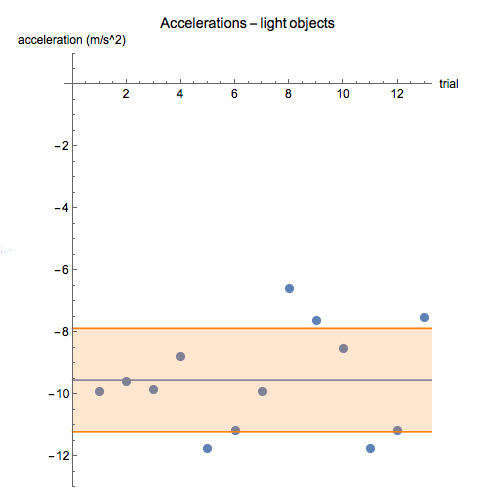
The average acceleration was -9.55 m/s^2, and the standard deviation was
$\sigma = 1.67$ m/s^2. We report this as "$\bar a_l=-9.55\pm 1.67$ m/s^2".
8/13=62% of the points are in the band $a_{\text{ave}}\pm \sigma$.
For the heavy objects, after we cut out two outlier points, the results (also graphed further below) was $\bar{a}_{h}=-9.14\pm 1.35$ m/s^2.
Comparing measurements
If you measure two quantities, say $a_{\text h}$ and $a_{\text l}$ how can you tell if they're different or not? Our criteria will be:
If two quantities are measured repeatedly, we judge the quantities to be different if the one-standard deviation ranges of each quantity do not overlap.
That is, $$\bar {a_h} -\bar{a_l} \geq \sigma_h + \sigma_l.$$
How do our accelerations compare?
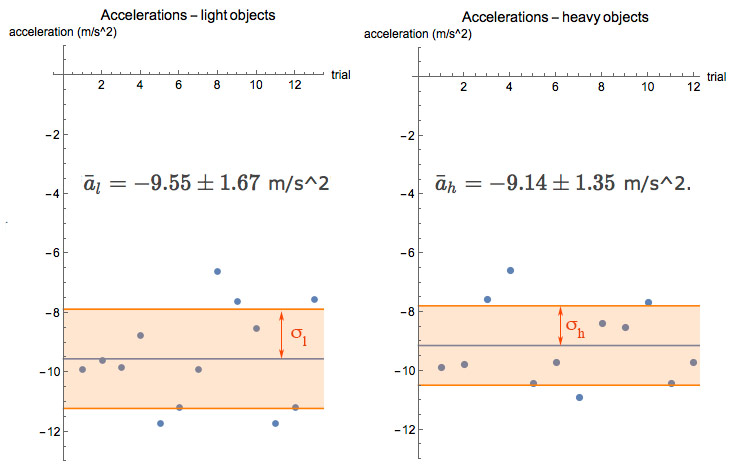
Clearly the 1-standard deviation ranges of these two measurements do overlap (almost completely).
Hypothesis?
Remember how *big* a difference there was in masses...
What would a better experiment look like??
Galileo's results
Watch this one...Brian Cox - World's biggest vacuum chamber.
Galileo's summary of his own results:
all objects accelerate the same near the surface of earth.
The typical value for acceleration near Earth's surface is "$g$"=9.8 m/s/s in the absence of air resistance.