

Fair Allocation Visualizations
Fair Allocation Visualizations
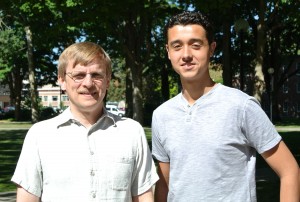
Informatics and mathematics major Philip Bontrager worked with Professor David Housman on a Maple Scholars project developing visualizations to assist in better understanding notions of fairness and their interrelationships in resource allocation problems.
Maple Scholars is an eight-week summer program that gives students the opportunity to participate in independent research projects alongside Goshen College faculty of various disciplines. Scholars keep each other informed of their progress in weekly seminars, and the program ends with a celebration involving a public poster session, presentations, and a dinner. Philip also presented his work during the 2012 Indiana Undergraduate Mathematics Research Conference held at Indiana University Bloomington, the 2012 MathFest held in Madison, Wisconsin, and the September 10, 2012 Goshen College Convocation.
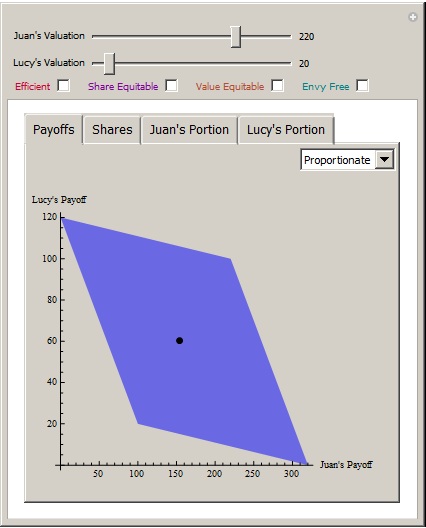
Juan and Lucy have inherited a stamp collection and $100 from their father. Of course, half of the stamp collection and $50 could be given to each sibling–this is called the equal split allocation. However, they have very different valuations for the stamp collection: Juan thinks it is worth $220 while Lucy thinks it is worth only $20. This opens up opportunities for better allocations.
For example, if Juan is given the entire stamp collection and Lucy is given the entire $100, then both are better off than with the equal split allocation: Juan receives $220 (the whole stamp collection) instead of $110 (half of the stamp collection) + $50 (half of the money) = $160, and Lucy receives $100 (all of the money) instead of $10 (half of the stamp collection) + $50 (half of the money) = $60. The $220 to Juan and $100 to Lucy corresponds to the upper right corner of the blue parallelogram in the above graphic, and the equal split allocation is represented by the black dot. The entire blue parallelogram corresponds to the valuations for all possible allocations of the stamp collections and money to Juan and Lucy. This is one of the visualizations Philip created.
The visualizations Philip created are dynamic. Juan’s valuations and Lucy’s valuations for the stamp collection can be changed with sliders and the graph of feasible valuations will update immediately.
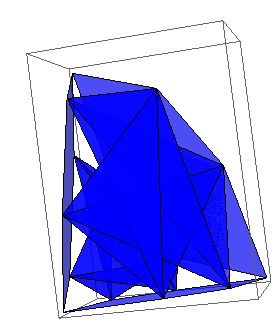
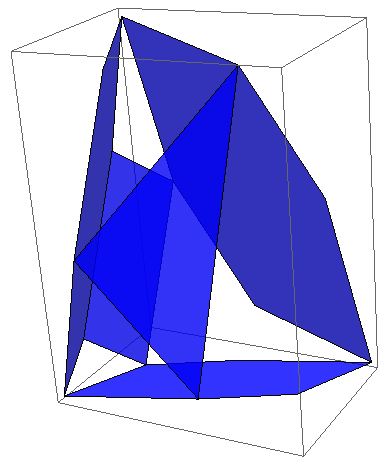
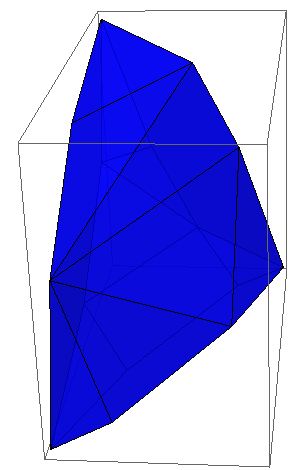
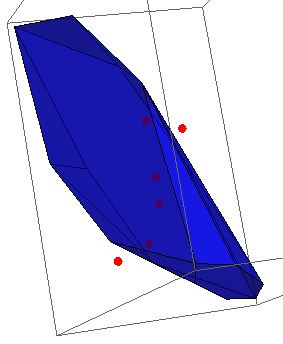
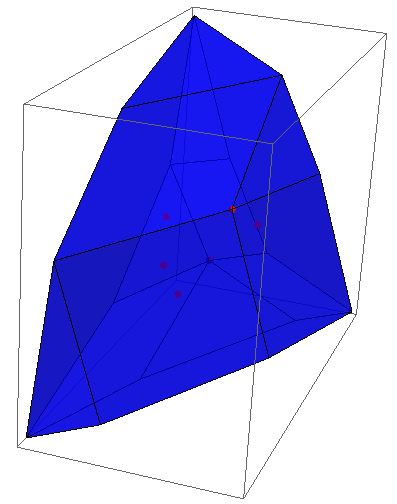
To extend the dynamic visualizations to three persons, Philip needed to develop highly efficient algorithms. The graphics below outline the primary algorithm at the core of his application.
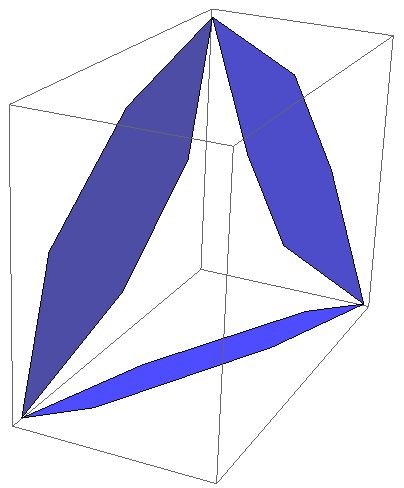 Two person cross sections of three person payoff graph |
|
|
|
|
|
|
Visualizing all possible allocations is a first step to determining fair ways to allocate the goods among the people. Philip’s application also allows users to view subsets of allocations that correspond to different notions of fairness including efficient, envy-free, share equitable, and value equitable.
Philip’s final report and two Mathematica notebooks can be accessed from David Housman’s Undergraduate Research Page.