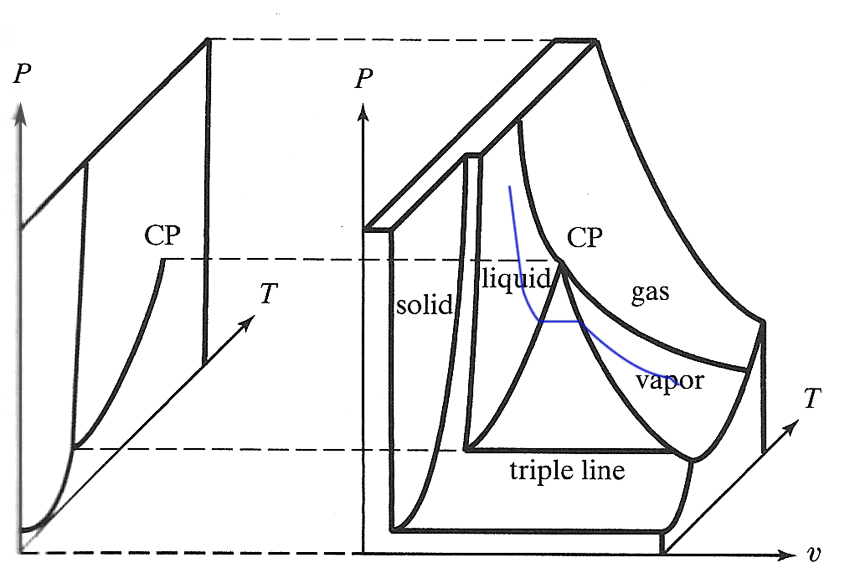
P-v-T diagrams
[Engineers] vs [Physicists]
[Ideal gas law plus real substances]
The equations of state we've seen so far are models which capture some common features of many substances, but are not necessarily exact for any particular substance. Chemical engineers typically depend on tables of thermodynamic properties of particular substances, tabulated at various $T$, $P$, and $v$ values more than an equation of state.

It looks like that triple line and the straight blue segment above are pointed straight out of the $P-T$ diagram. Is that exactly or only approximately true?
Water...
- CP$\equiv$ "Critical Point" @ 374.2 C, 207 atm.
- Triple point @ 0.01 C, $6 \times 10^{-3}$ atm.
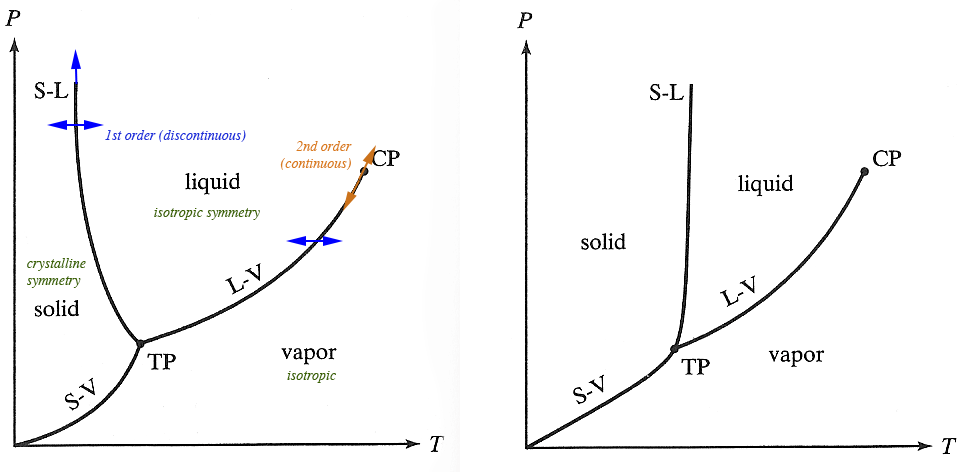
- expands on freezing. (It's more common for substances to contract on freezing.)
- Volume change at ~0 C: 10 cc water $\rightarrow$ 11 cc ice.
- Volume change: at 100 C: 1 cc water $\rightarrow$ 1600 cc steam.
$P-T$ phase diagrams

Which substance expands on freezing, or (the same thing:) contracts on melting? Explain how you know...