Support GC students today by making your gift to the GC Fund before our fiscal year ends on June 30! goshen.edu/give
This presidential column originally appeared in the Spring/Summer 2026 issue of Bulletin
Support GC students today by making your gift to the GC Fund before our fiscal year ends on June 30! goshen.edu/give
News
Jun 01 2022
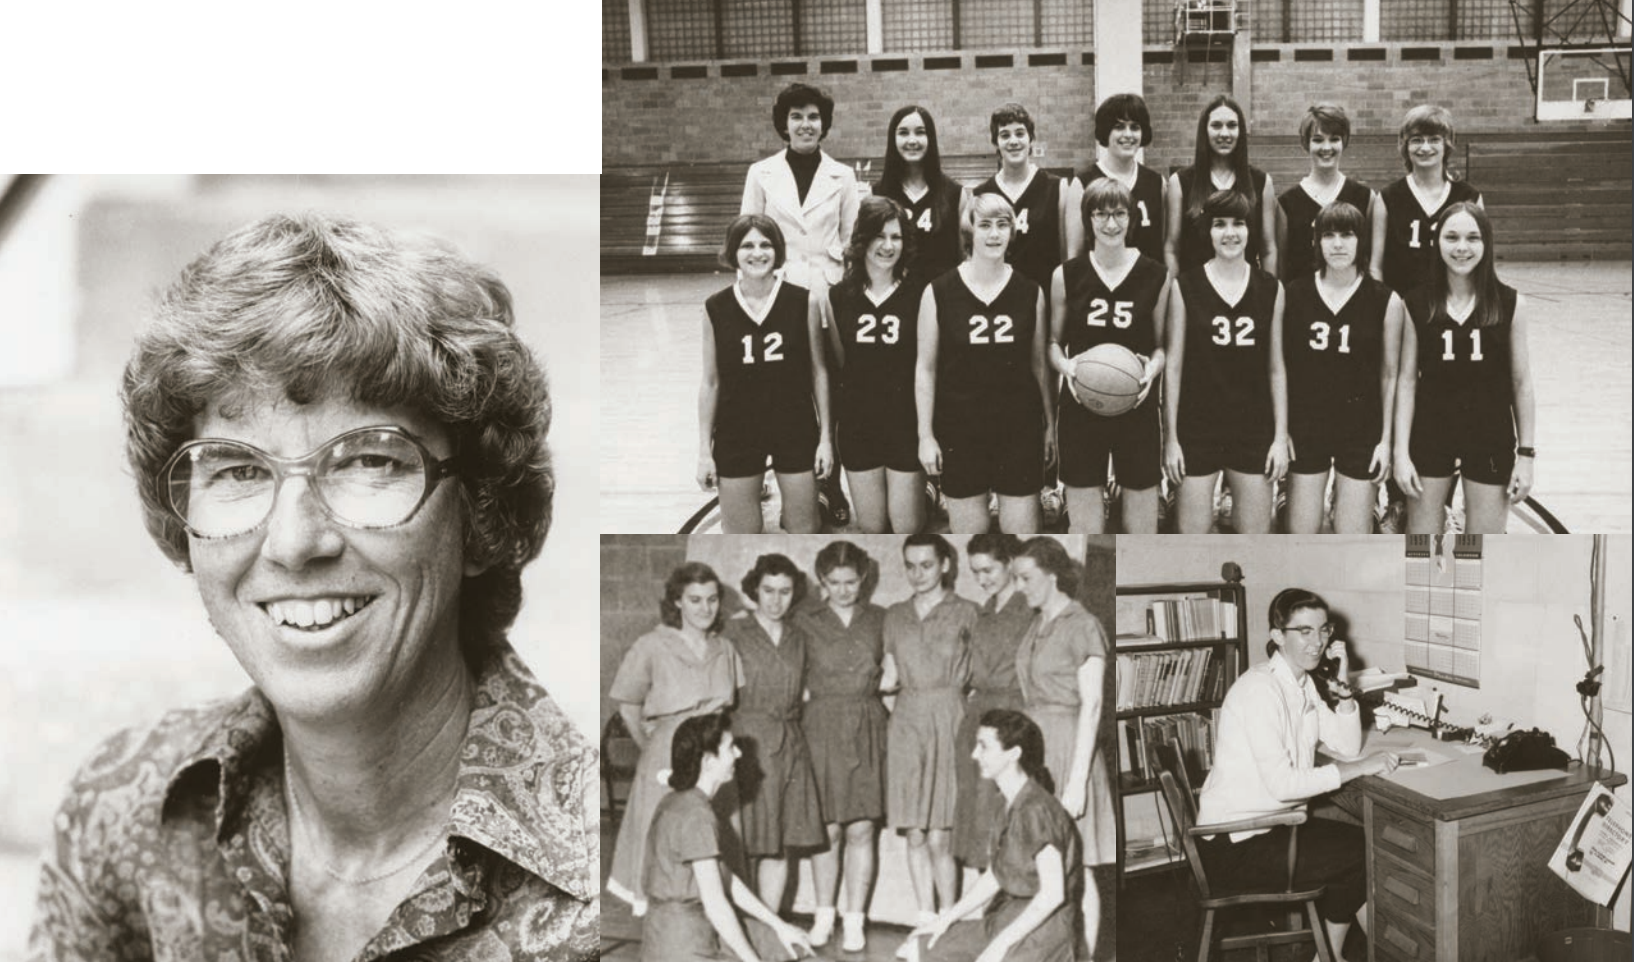
Pictured: This collage of images includes the 1952 and 1973-74 women’s basketball teams Ruth Gunden ’52 coached, her working at her desk in 1958 and a 1980s mugshot. Gunden’s official intercollegiate coaching record spanned 1965-1985 and three sports: basketball, tennis and volleyball (cumulative record: 196-107-1). Throughout the late 1960s and 1970s, Gunden was directly involved in leadership of state, regional and national associations for women’s athletics. Of particular note were her contributions to the codification of rules and practices of the National Association for Girls & Women in Sports (NAGWS).
This article originally appeared in the Spring/Summer 2022 issue of The Bulletin.
BY JOE SPRINGER ’80, curator, Mennonite Historical Library
“Conned” by five older brothers into learning to catch and throw, Ruth E. Gunden ’52, professor of physical education from 1953 to 1994, spent much of her nine decades practicing and promoting the “joys of movement.”
In the 1950s intercollegiate athletic opportunities for women were few, and in Indiana, practically nonexistent. As Goshen College’s men’s athletic teams of the era were striving for permission to join established regional and state intercollegiate associations, Gunden positioned the college to become charter members of similar groups that finally emerged for women. “You have to play to improve,” Gunden would say, busily promoting every available intramural and extramural possibility. Invitational “sports or play days” had GC’s women’s teams competing on equal footing with teams large and small. Similar matches continued as intercollegiate play became formalized. GC women played Indiana University, Purdue University (whom they beat three times in 1973-74 in basketball) and The Ohio State University.
Well before the 1972 enactment of Title IX — celebrating its 50th anniversary this year — Gunden had secured the role of women in GC’s physical education curriculum and athletic philosophy. Parity of budgets and the number of intercollegiate sports offered would require additional work and time.

This presidential column originally appeared in the Spring/Summer 2026 issue of Bulletin
No single course may better define Goshen College’s commitment to liberal arts education than Mary Oyer’s Fine Arts class, first introduced in 1945.

My professional connection to Goshen College began in 1988, when Sociology Professor Emeritus J. Howard Kauffman hired me as a research assistant for his work on North American Mennonite beliefs and social patterns.